
Can this truck make this route? Now you know.
PTV Logistics is a leading German provider of logistics software. The EV Truck Route Planner answers the question fleet operators face when switching to electric trucks: is this route feasible on battery — and with how much margin?
Planners set a pickup point and stops, and the tool calculates the route using realistic digital truck models — factoring in load weight, road elevation, weather and driving behavior — and shows exactly how the battery will hold up along the way.
Charge level calculated along the route, kilometer by kilometer
Instantly see if a route is safe, borderline or not possible
Load, elevation, weather and vehicle profiles shape the result
Pickup point, stops, calculate — a workflow planners already know
Who Uses It
Simulating whether routes are feasible with electric fleets
Evaluating the switch from diesel to electric trucks
Planning operations around range and charging
My Role
I joined a project that had been started — the user research and analysis were done — and my job was to build the product out: designing the functionality that turns calculations into decisions planners can trust.
- Continued a partially built product, working from existing research and user needs analysis
- Designed the route card and map visualization — the core surface where planners read route feasibility
- Made battery level along the route instantly readable: charge percentage at each stage of the journey
- Designed the three feasibility states — comfortable, borderline, and not possible — so the verdict is visible at a glance
- Worked with complex interdependent parameters (load, elevation, vehicle profile) feeding the calculation
- Worked in a Scrum team with PM, business analysts, developers and QA
Challenges & Solutions
The battery calculation depends on many parameters — load, elevation, weather. Oversimplify and planners can't trust it; show everything and they drown.
→Designed the route card to lead with the verdict — battery % and state — with contributing parameters one level below. Trust first, detail on demand.
The difference between "tight but doable" and "won't make it" is an operational decision with real costs.
→Created distinct, unmistakable states — comfortable, borderline, critical — using color, iconography and battery indicators that can't be misread.
The product was already begun; research existed, screens partially did.
→Absorbed the existing analysis, kept the established patterns, and designed the missing functionality to feel like one continuous product.
Product Screens
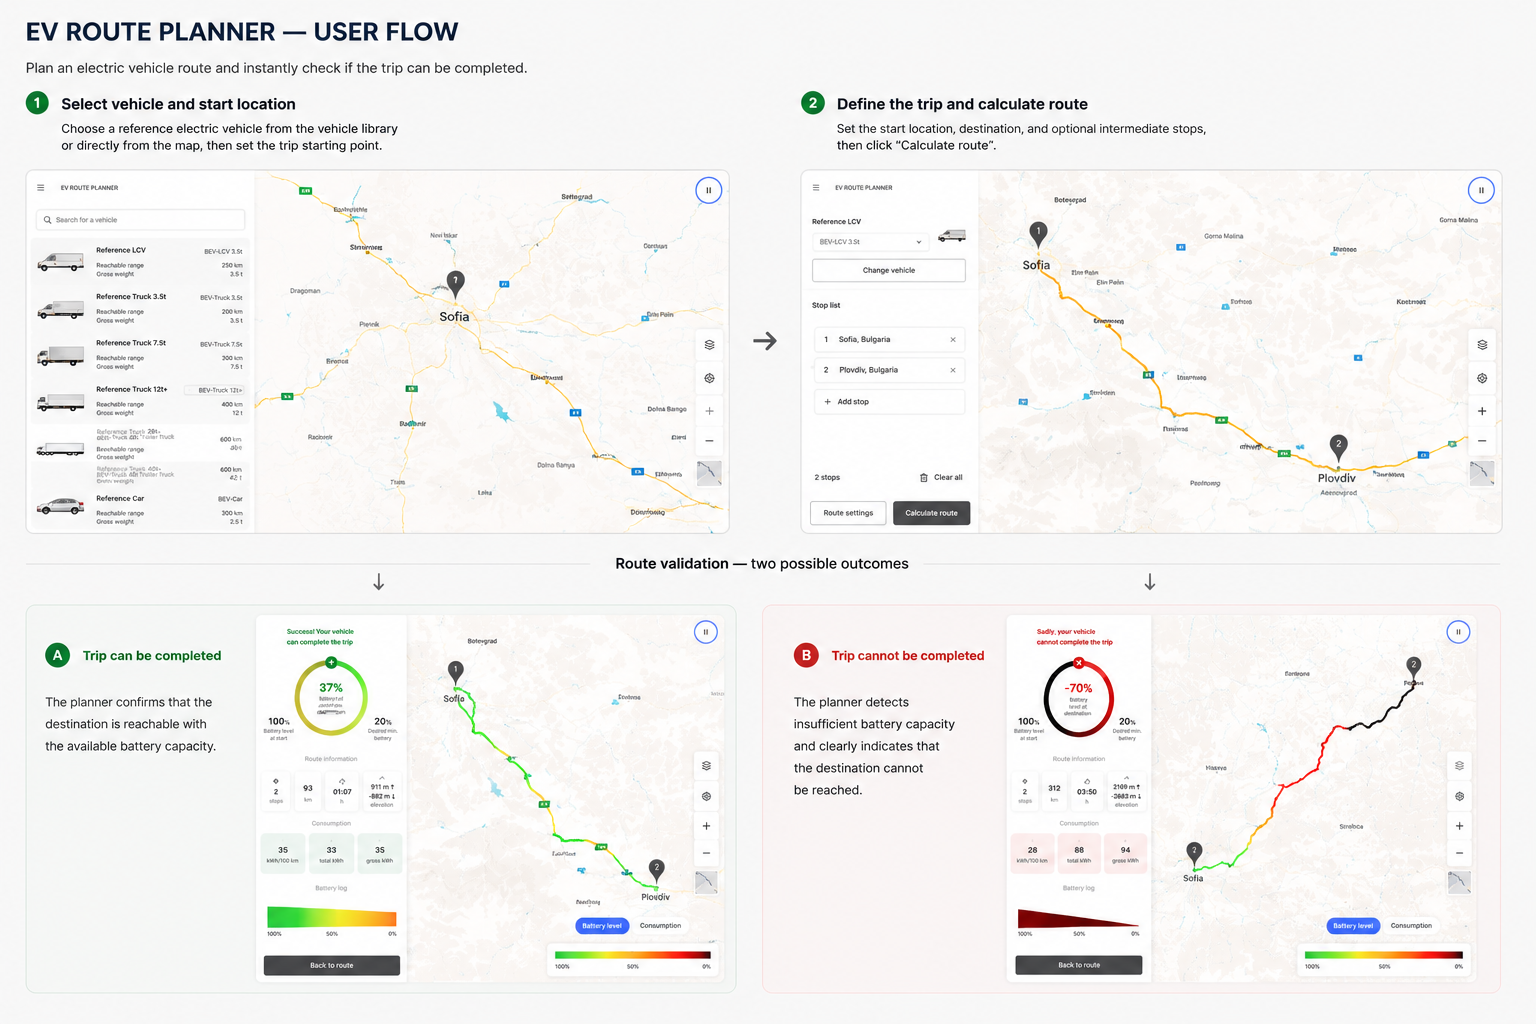
EV Route Planner — user flow, from vehicle selection to route validation